
Property Amenities: The Strategic Approach to Amenity Selection
Understanding which amenities at rental properties deliver genuine value versus those that merely drain resources is critical to maximizing returns.


Did you know that property amenities typically account for approximately 6% of total rent revenue? This seemingly small percentage can actually make or break your investment strategy when properly leveraged.
For property investors and managers navigating today's competitive rental market, understanding which amenities at rental properties deliver genuine value versus those that merely drain resources is critical to maximizing returns.
This comprehensive guide explores how to strategically evaluate and select rental property amenities using a structured decision-making framework that balances implementation costs against tenant value.
The Amenity Value Matrix: A Strategic Decision-Making Tool
The property management industry increasingly relies on data-driven approaches to amenity selection rather than following trends or personal preferences.
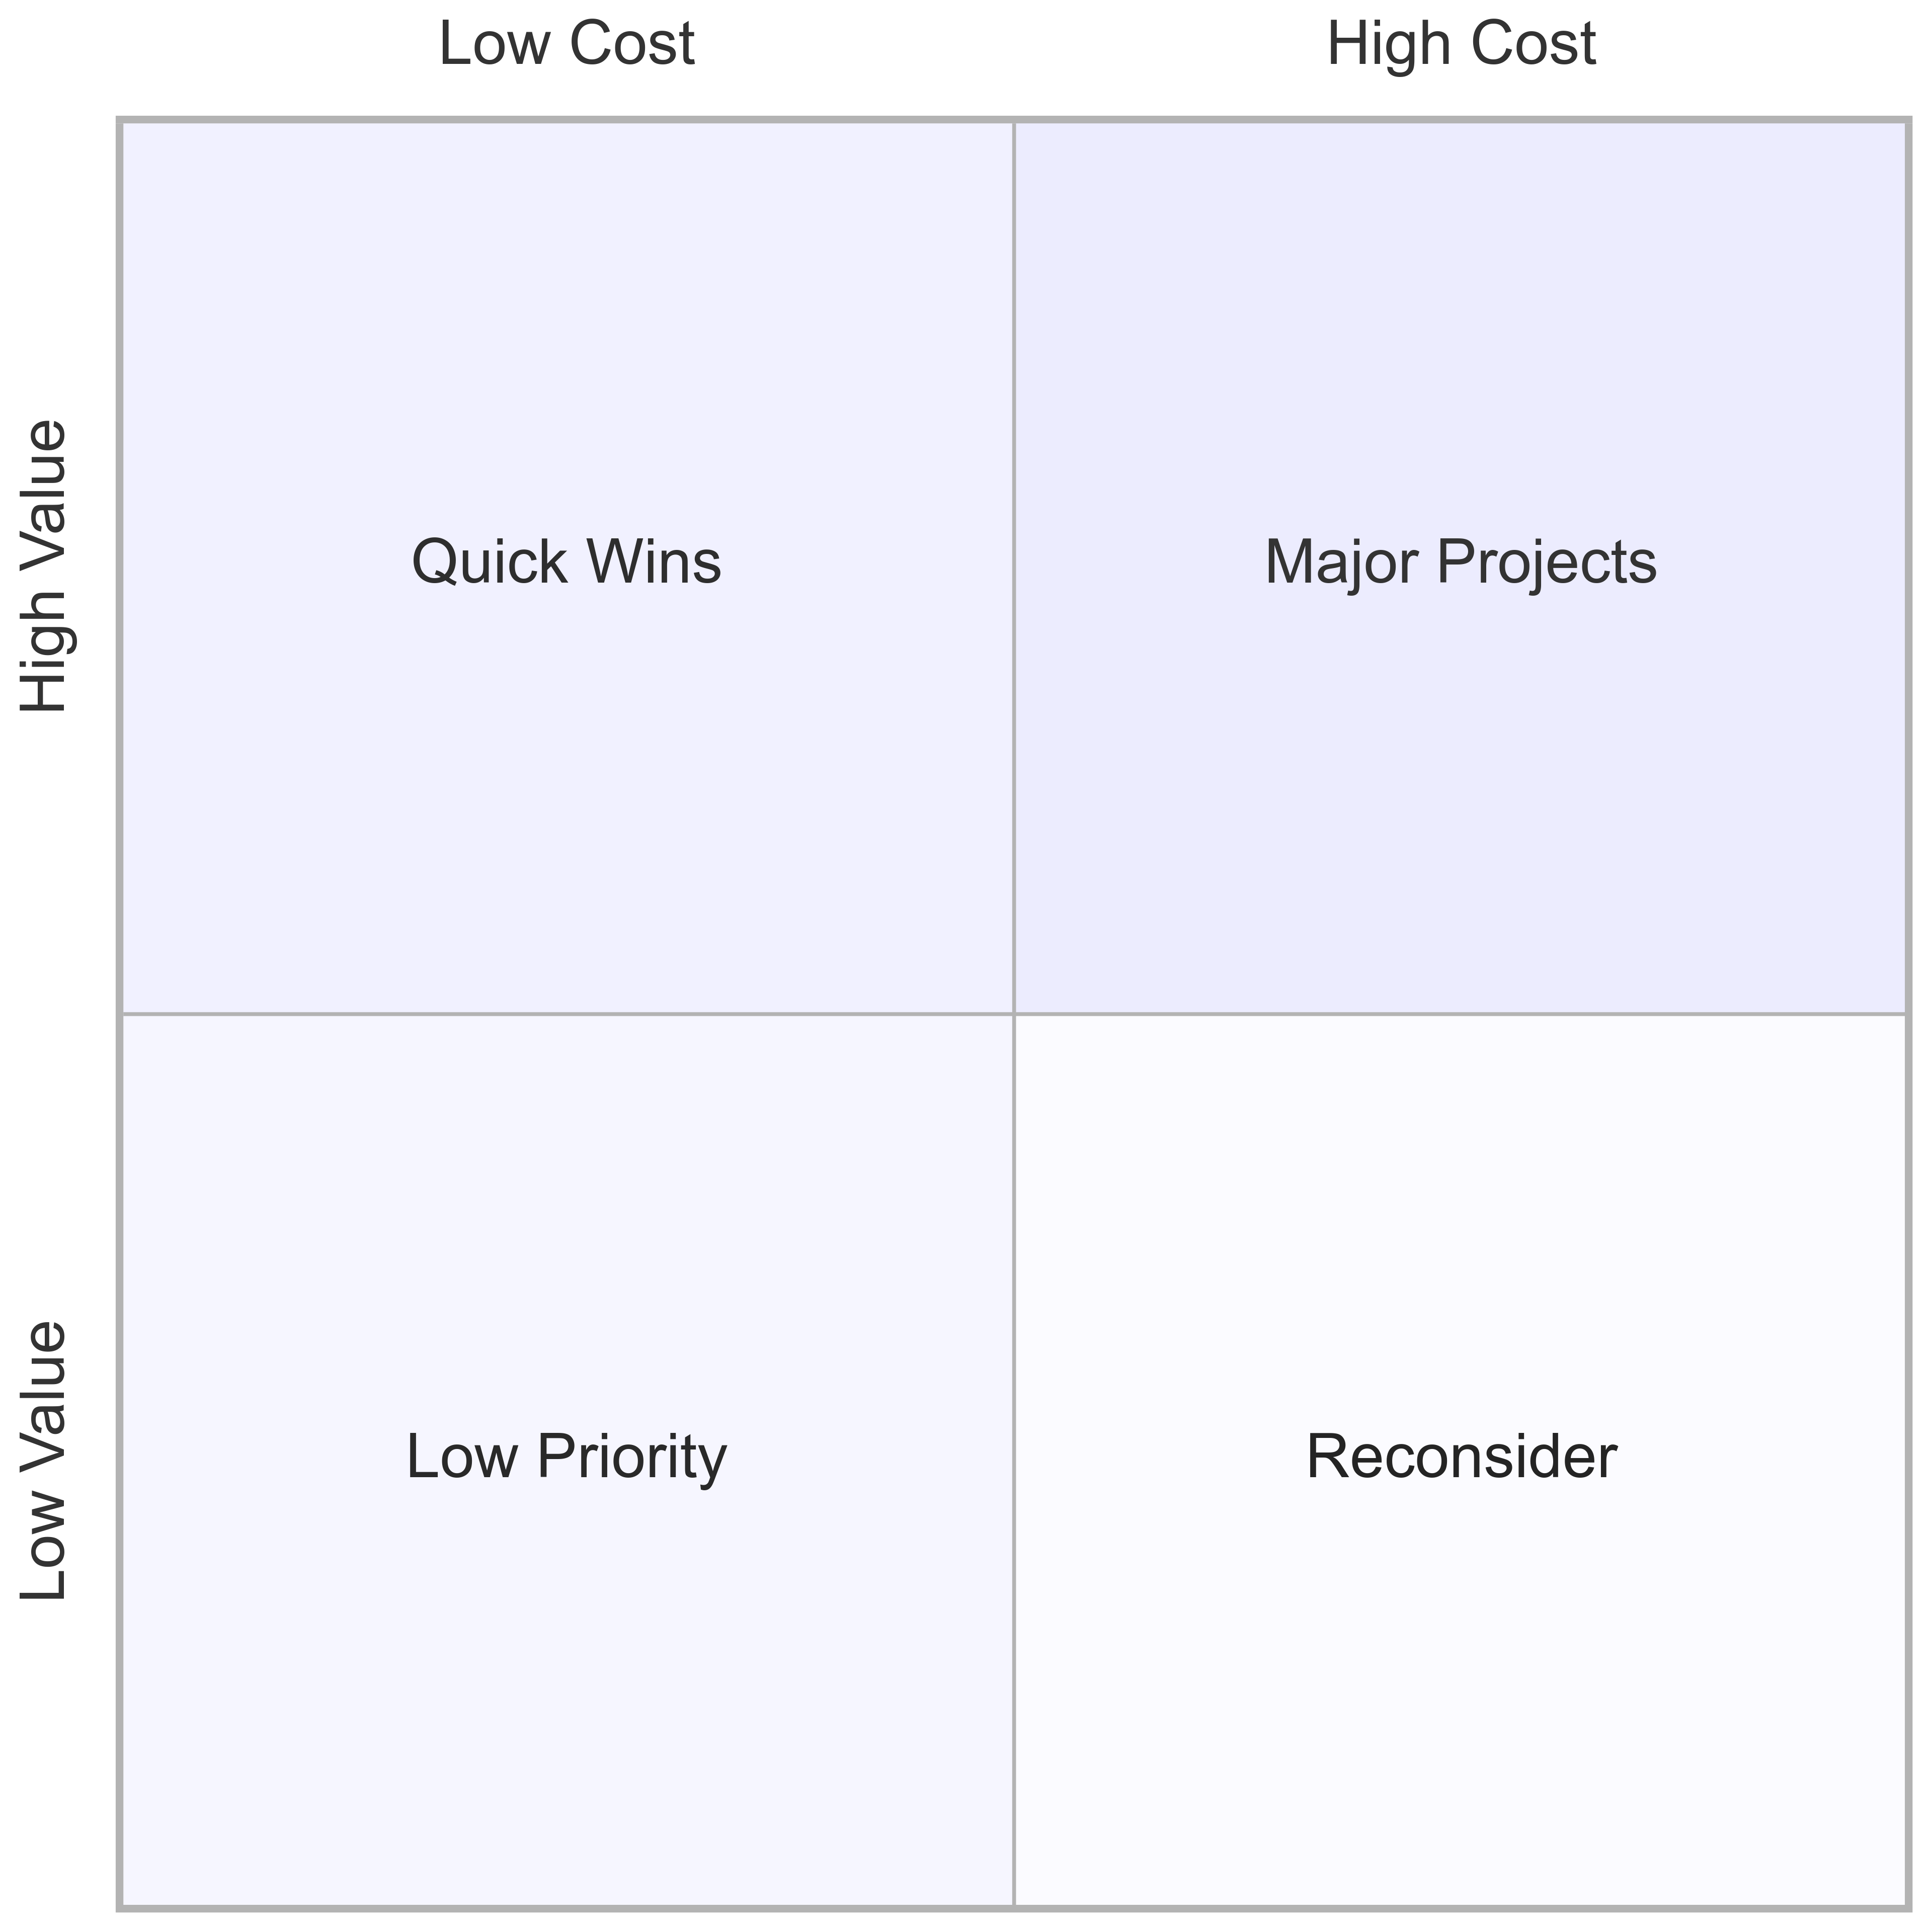
The Amenity Value Matrix provides a quadrant-based visualization tool that transforms complex cost-benefit analysis into an intuitive framework for strategic investment decisions.

This matrix plots amenities according to two critical variables:
- Implementation cost (x-axis)
- Tenant value (y-axis)
The resulting four quadrants help property managers categorize potential investments:
Quick Wins (Low Cost, High Value)
These amenities should be your first priority, as they deliver significant tenant satisfaction with minimal investment:
- Pet-friendly policies: With approximately 70% of renters owning pets and implementation costs between $1,000-5,000, pet-friendly features receive an 8/10 value rating from tenants. Industry professionals cite pet amenities as offering the second-highest ROI at 24.9% preference.
- Valet trash service: This convenience feature typically costs residents $25-30 monthly while requiring modest implementation costs of $2,000-8,000. Tenants consistently rate this service 7/10 for value.
- High-speed WiFi: While requiring moderate initial equipment costs ($10,000-25,000), internet access ranks among tenants' most essential amenities. Residents often pay $70-110 monthly for individual service, making property-provided options highly attractive.
Major Projects (High Cost, High Value)
These investments require substantial capital but deliver proportionate tenant satisfaction:
- Fitness centers: Despite implementation costs of $50,000-150,000, fitness centers rank as the highest-ROI community amenity at 27.1% preference. Modern renters prioritize health and wellness facilities as a major selling point.
- In-unit washer/dryers: With implementation costs of $25,000-40,000 per unit, this feature commands consistent rent premiums and reduces tenant turnover. It ranks 13.8% for ROI preference among industry professionals.
- Swimming pools: While expensive to build ($75,000-250,000) and maintain, pools remain a signature amenity that significantly enhances marketing appeal and perceived property prestige. Pool maintenance requires regular cleaning, chemical treatments, and repairs that impact operating expenses.
Low Priority (Low Cost, Low Value)
These amenities should be considered only after higher-value options have been implemented:
- Business centers: Traditional business centers show declining relevance at just 2.1% ROI preference, as remote work trends favor in-unit workspaces over communal business facilities.
- Package lockers: While addressing a functional need, basic package management solutions generate limited excitement or rent premium potential.
- Community bulletin boards: Digital communication has largely superseded physical announcement spaces, limiting their impact on tenant satisfaction.
Reconsider (High Cost, Low Value)
These amenities should generally be avoided unless specific property demographics indicate otherwise:
- Tennis courts: High construction costs ($50,000-100,000) coupled with limited usage patterns make tennis courts questionable investments for most properties.
- Elaborate water features: Decorative fountains create visual appeal but generate high maintenance costs with minimal rent premium potential.
- Movie theaters: Despite their appeal in marketing materials, dedicated screening rooms often see limited usage that doesn't justify their significant space allocation and equipment costs.
State-by-State Variations in Amenity Priorities
Property managers should recognize that amenity preferences vary significantly by region due to climate, demographic, and regulatory differences:
- Sunbelt states (Florida, Arizona, Texas): Outdoor amenities like pools and outdoor kitchens command higher value premiums due to year-round usability.
- Northeastern and Midwestern states: Indoor fitness facilities and community spaces typically generate stronger returns in areas with harsh winters.
- West Coast markets: Technology amenities and sustainability features consistently outperform national averages in tenant value ratings.
- Urban vs. suburban locations: Parking amenities deliver dramatically different value depending on local transit options and density patterns.
Practical Implementation Strategy
Instead of treating amenity selection as a series of isolated decisions, property managers should approach it as a portfolio strategy:
- Conduct market-specific research: Tenant preferences vary significantly by location and demographic. What works in luxury urban apartments may fail in suburban workforce housing.
- Balance your investments: The ideal approach combines several "Quick Wins" with one or two strategic "Major Projects" that align with your property's target demographic and competitive positioning.
- Measure true amenity value: According to RealPage's analysis, benchmarking units with specific features against those without provides the clearest picture of true amenity value. This approach isolates the rent premium directly attributable to each feature.
- Consider indirect benefits: Amenity valuation should incorporate both direct financial metrics (rent premiums, vacancy reduction) and indirect benefits (tenant retention, referral generation).
- Reassess regularly: Tenant preferences evolve rapidly. What delivered strong returns five years ago may now underperform. Regular reassessment using updated market data ensures your amenity offerings remain competitive.
Property Amenity Investment Checklist
Did you know? High-impact amenities can increase your property's NOI by up to 15% when strategically selected! However, following industry trends without market-specific analysis can lead to expensive investments with minimal returns.
Step 1: Conduct Market-Specific Research
Step 2: Balance Your Investment Portfolio
Step 3: Measure True Amenity Value
Step 4: Consider Indirect Benefits
- Florida: Enhanced pool safety requirements
- California: Water conservation regulations for landscaping
- New York: Specific requirements for rooftop amenities
- Colorado: Snow removal considerations for outdoor spaces
Step 5: Establish Regular Reassessment Schedule
Priority Recommendations by Property Type
Suburban Multifamily
- Pet-friendly features (washing stations, relief areas)
- Enhanced outdoor spaces (grilling areas, seating)
- In-unit laundry facilities
- Property-wide WiFi solutions
- Modest fitness facilities
Urban High-Rise
- Package management solutions
- Co-working spaces
- High-end fitness centers
- Rooftop community areas
- Smart home technology integration
Student Housing
- High-speed internet infrastructure
- Study spaces and academic amenities
- Fitness facilities
- Transportation/shuttle services
- Enhanced security features
Action Plan Template
| Amenity | Investment Category | Implementation Cost | Expected Value | Timeline | Responsible Party |
|---|---|---|---|---|---|
Case Study: Transforming Property Value Through Strategic Amenity Selection
A 150-unit apartment community in Denver implemented an amenity optimization strategy based on the Value Matrix framework. Rather than following industry trends, management conducted tenant surveys and competitive analysis to identify their specific market's highest-value amenities.
The property reallocated funds from an underutilized tennis court to develop:
- A modernized fitness center with on-demand classes
- Pet washing stations and a dedicated relief area
- Property-wide high-speed WiFi
- Enhanced outdoor gathering spaces with grilling areas
Within 18 months, the property achieved:
- 7% increase in average rental rates
- 22% reduction in tenant turnover
- 15% decrease in average vacancy duration
- 9.4% overall increase in NOI
Conclusion
The Amenity Value Matrix transforms abstract cost-benefit analysis into an intuitive strategic framework for property investment decisions. By plotting amenities according to implementation cost and tenant value, property managers can identify the optimal allocation of limited improvement budgets.
This approach enables evidence-based decision-making, helping managers prioritize amenities that maximize ROI while avoiding common pitfalls like basing investment decisions solely on current trends or personal preferences. As tenant expectations continue to evolve, regular reassessment using updated market data will ensure your property remains competitive in attracting and retaining high-quality tenants.
Research shows that high-quality park-like views can increase property values by approximately 4.6%, translating to a price increase of around $15,180 for a median-priced home of $330,000. This positions strategic landscaping as a potential "Quick Win" in the amenity matrix.
Remember that the "sweet spot" typically includes pet amenities, enhanced WiFi infrastructure, modest fitness facilities, smart home technology packages, and communal gathering spaces. Focus your investment strategy on these areas for the strongest returns on your property improvement dollars.


